In September 2025, EPA issued an enforcement alert specifically addressing compliance concerns with benzene fenceline monitoring regulations at petroleum refineries. The alert emphasizes that facilities must conduct thorough root cause analyses and implement appropriate corrective actions when the benzene annual average ∆C (delta-C) exceeds the 9 µg/m³ action level.
The ∆C value represents the difference between the highest and lowest benzene concentrations measured at fenceline monitoring locations, calculated as an annual average based on the 26 most recent 14-day sampling periods. When this rolling annual average ∆C exceeds 9 µg/m³, facilities must initiate root cause analysis within five days.
The enforcement alert highlights a critical challenge: the 14-day passive sampling required by Method 325 creates inherent difficulties in identifying root causes. The source of benzene emissions may no longer be emitting at the time the investigation begins. In response, EPA explicitly identifies real-time monitoring as a best practice, stating that “monitors, such as gas chromatographs that can provide near real-time measurement, can be better correlated with wind direction than the two-week diffusion tube samples required by Method 325.”
If your refinery’s annual average ∆C has exceeded 9 µg/m³ or you’re trending toward an exceedance, the difference between meeting compliance and facing enforcement action often comes down to how quickly you can identify sources and implement effective corrective measures.
When to Consider Real-Time Monitoring for Your Facility
While continuous monitoring provides value for any facility managing benzene emissions, it becomes especially critical in the following situations:
- Your rolling ∆C average is approaching 9 µg/m³ action level
- You’ve exceeded the action level and need to identify sources for a corrective action plan
- Passive sampling shows elevated concentrations, but you’re unsure which facility area is contributing
- You suspect off-site or upwind sources may be influencing your fenceline readings
- You’re developing a site-specific monitoring plan and need time-resolved data to support source apportionment
- Operational changes or expansions have created uncertainty about new emission patterns
The Limitations of Time-Integrated Sampling for Root Cause Analysis
EPA Method 325 A/B was designed to detect benzene concentrations at the fenceline, but its 14-day integrated sampling approach presents challenges when trying to determine where elevated readings are coming from:
Time Delay: By the time the lab results return, the emissions event may be over, leaving no record of when concentrations spiked or what conditions were present.
Wind averaging: Two weeks of shifting wind patterns get compressed into a single concentration value, obscuring the direction from which emissions originated.
Point measurements: Summa canisters and passive tubes capture what’s happening at one specific location. If wind patterns shift during the sampling period, the canister may miss the plume entirely or capture it inconsistently.
Limited actionability: A high ∆C reading indicates there is a problem, but it doesn’t tell you which unit, process, or time window to investigate.
How Real-Time Monitoring Technologies Support Source Attribution
When facilities deploy continuous monitoring alongside their passive sampling programs, they gain the temporal and spatial resolution needed to trace benzene back to its source. Rather than waiting weeks for results, environmental teams can observe concentration trends as they develop and correlate them with operational data, wind direction, and facility activity.
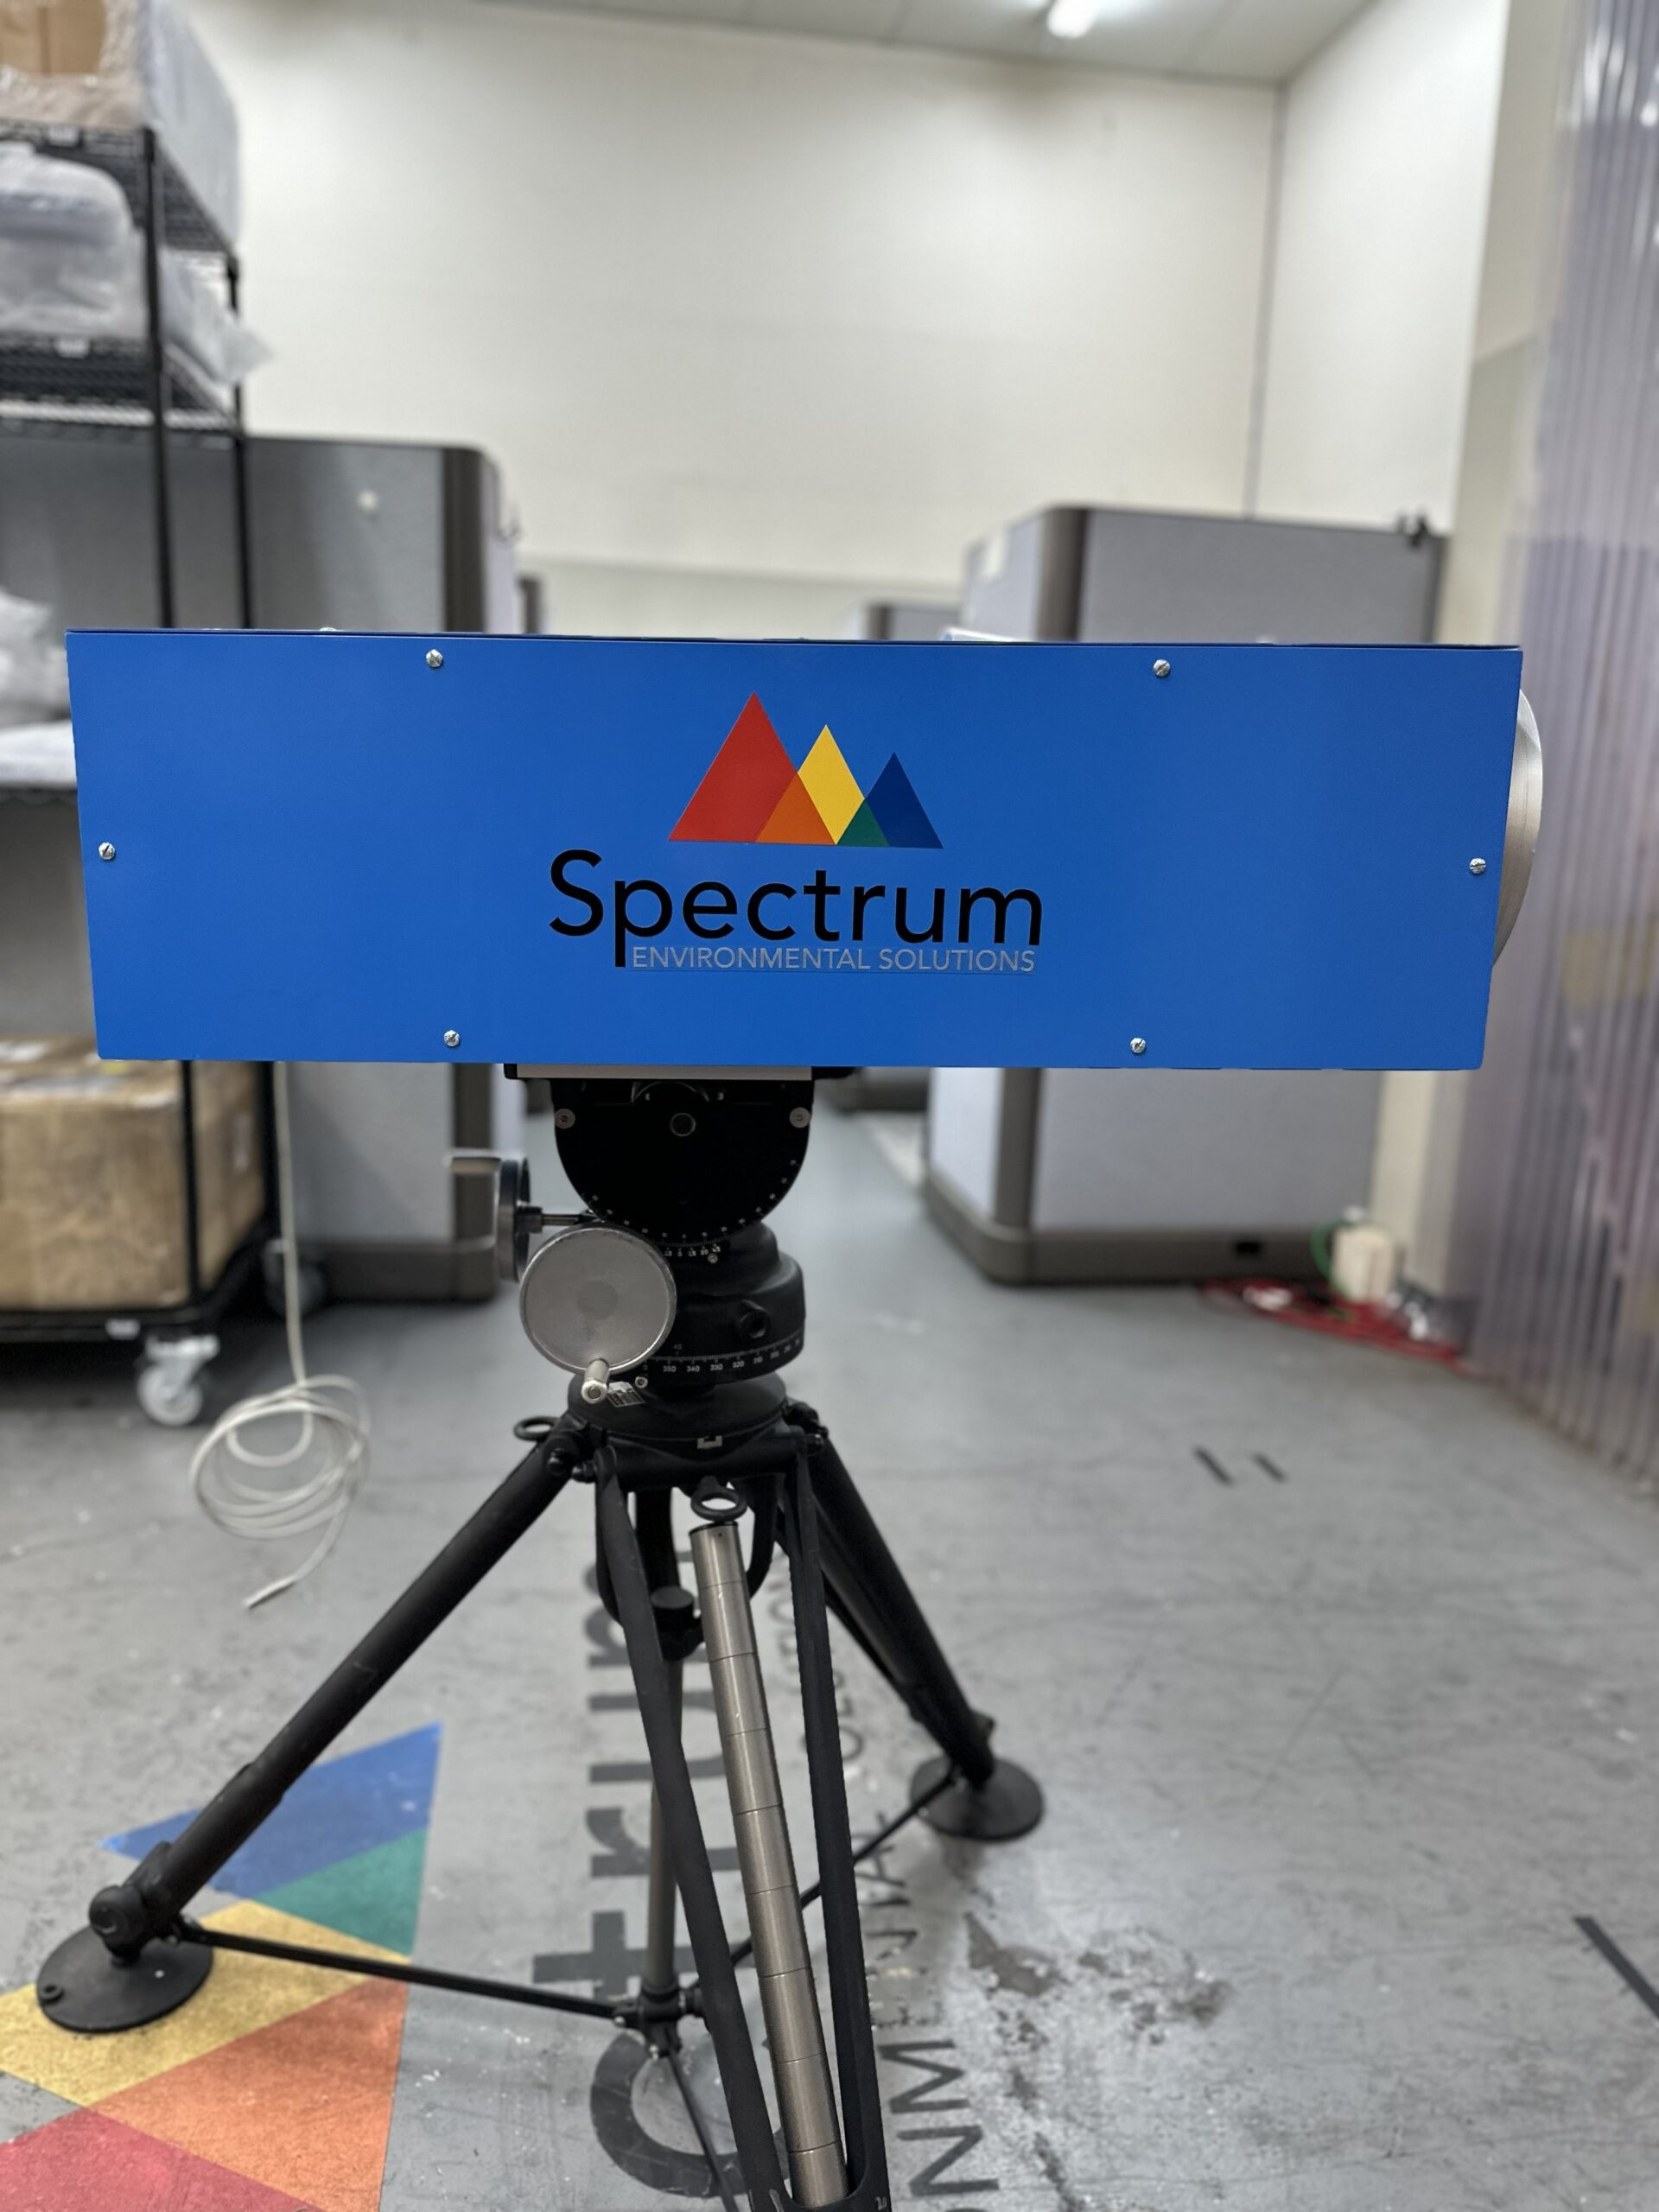
Point Monitoring with Automated Gas Chromatography
Deploying mobile Gas Chromatograph systems at targeted fenceline locations provides 15 to 20-minute measurement cycles with detection limits well below EPA action levels. These systems deliver compound-specific data, distinguishing benzene from other VOCs, and timestamp each reading so you can see exactly when concentrations rise and fall.
Combined with meteorological data, Auto-GCs help answer key questions: When did the spike occur? What were the wind conditions? Which area of the facility was upwind at that time?
Open-Path Fenceline Monitoring for Continuous Detection
Passive tubes integrate air over a 14-day period, but with winds constantly shifting direction during that time, there’s no way to determine where the sampled air actually came from. A canister might capture air from your facility one day, from an upwind neighbor the next, and from a completely different direction by week two, all compressed into a single concentration value.
Open-path instruments measure across a beam of light – typically 100 to 500 meters in length – providing a path-averaged measurement that addresses several limitations of point sampling:
- Spatial coverage: The plume just needs to cross anywhere along the beam, not pass directly over a single sampling point. This significantly increases the probability of capturing emission events.
- Near real-time data availability: Open-path systems provide continuous measurements, allowing you to correlate concentration changes with operational events and wind conditions as they occur.
- Representative measurements: Path-averaged concentrations across 100+ meters better represent actual fenceline conditions than a point measurement, which can spike dramatically due to micro-scale turbulence of brief puffs.
- Reduced positioning sensitivity: You don’t need to guess exactly where the plume will cross the fenceline. Minor shifts in wind direction won’t cause you to miss the plume entirely.
- More consistent ∆C values: Because measurements are averaged across the beam path rather than captured at a point, open-path systems typically show less variability from measurement to measurement. This often results in lower, more consistent ∆C values. Not because emissions are hidden, but because the measurement is more representative of actual boundary conditions.
- Better for health impact assessment: An averaged measurement across a longer distance is more relevant for understanding potential community exposure than what’s happening at one precise point.
The Source Identification Process with Real-Time Data
The traditional approach to investigating fenceline exceedances often means waiting weeks for lab results, then reviewing two weeks’ worth of maintenance logs, process records, and weather data to guess what might have happened. By that point, the emissions event is long over, and you’re left trying to reconstruct what occurred based on incomplete information.
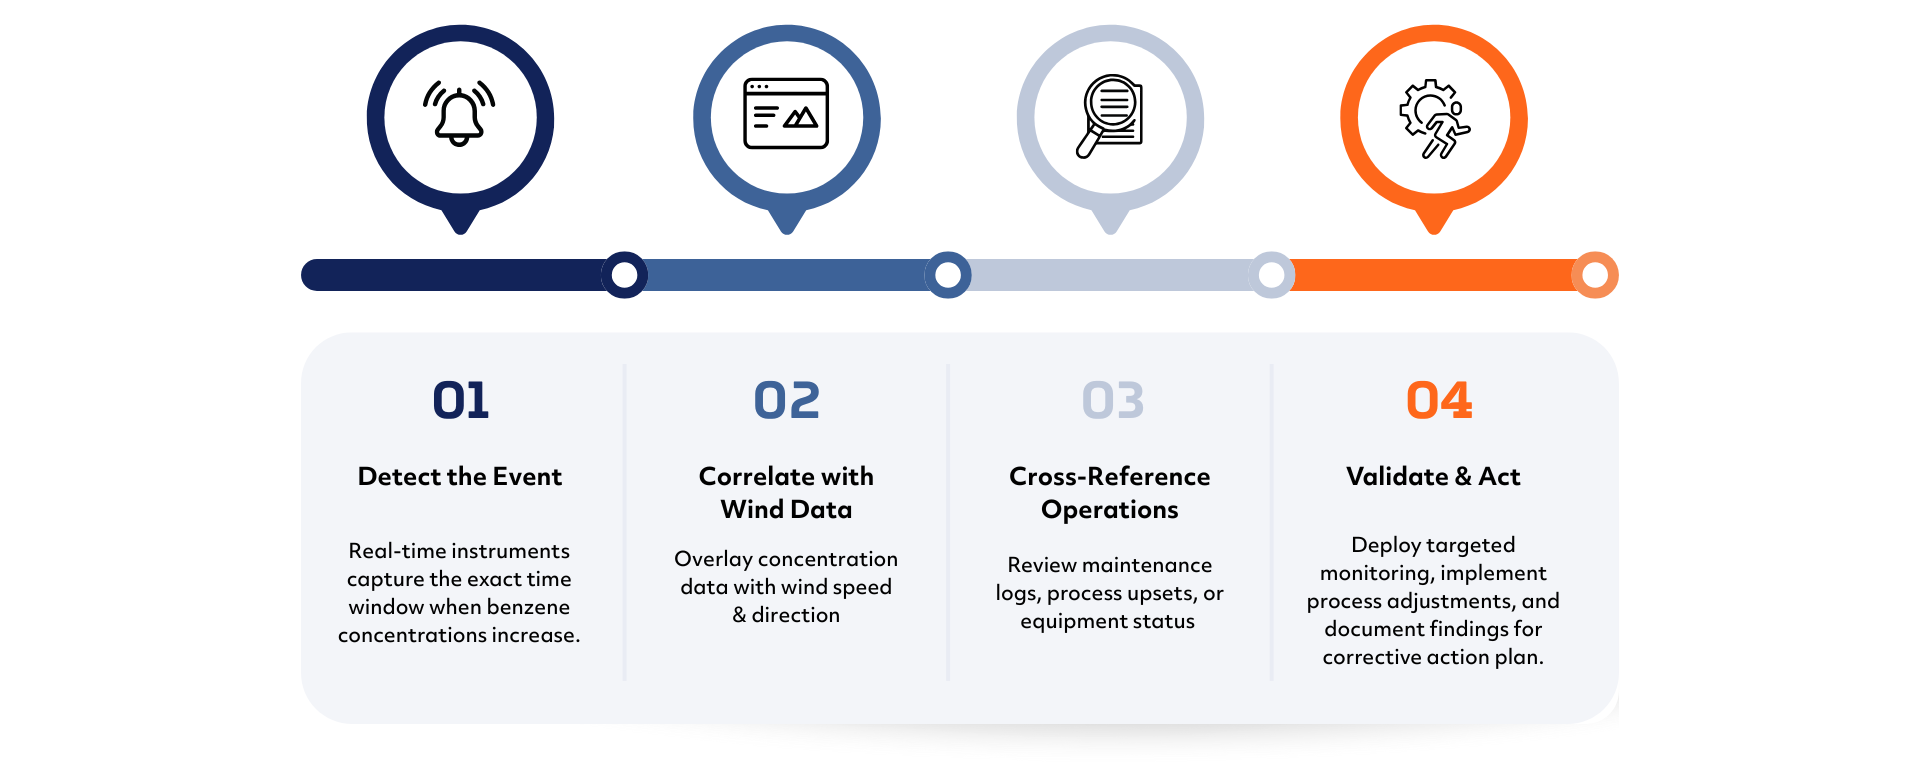
Real-time monitoring changes this model. Instead of investigating backwards from a delayed result, you can identify and respond to emission events as they happen, or within hours of occurrence. Here’s how that process typically works:
1. Detect the Event: Real-time instruments capture the exact time window when benzene concentrations increase.
2. Correlate with Wind Data: By overlaying concentration data with wind speed and direction, you can determine which part of the facility was upwind during the event.
3. Cross-Reference Operations: With a narrowed time window and directional data, operations teams review maintenance logs, process upsets, or equipment status to identify likely emissions sources.
4. Validate and Act: Deploy targeted follow-up monitoring (if needed), implement process adjustments, and document the findings to support your corrective action plan.